A thermal imaging camera sounds like professional gear for thermographers or energy consultants. But as a smart home enthusiast, I use one for all kinds of things: checking electrics, finding hotspots in devices, inspecting my solar array – and making problems visible that all my sensors in Home Assistant simply cannot detect.
Transparency: The Thermal Master P3 was provided to me free of charge by the manufacturer – with no conditions on the content. (Ad)
What a thermal image actually shows
The color gradient from blue to red shows temperature differences – but relatively: the coldest spot in the image is always blue, the warmest always red, whether we’re talking 20 or 80 degrees. For context, the camera displays the warmest and coldest spot as absolute readings, plus the exact temperature at the center of the image.
One detail shows how sensitive it is: the imprint of my hand on the desk was still visible seconds later – from body heat alone.
The Thermal Master P3 offers a resolution of 512×384, a focus ring for close-up and distance shots, and a dual-image mode that overlays the thermal and the visual image.
Use case 1: Checking Shelly flush-mounted boxes
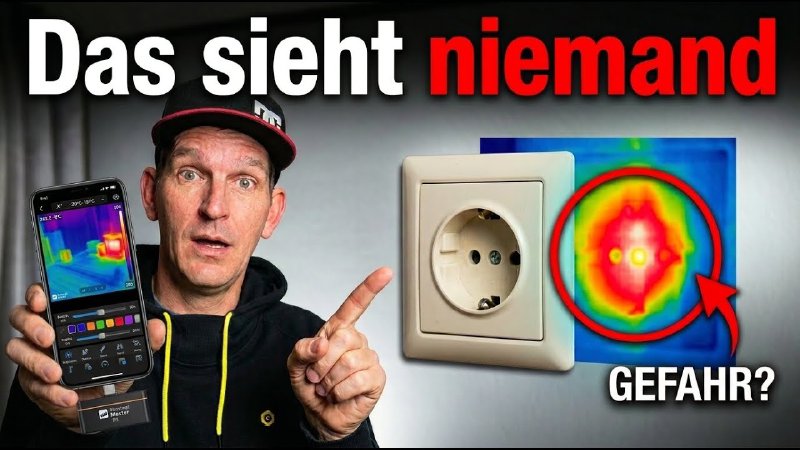
Behind one of my light switches sits a Shelly 1 Plus for the underfloor heating. From the outside everything looks normal – but the thermal image shows 25 degrees on the outside of the box, with an ambient temperature of 21 degrees. Inside it’s definitely more – otherwise nothing would be measurable outside.
It’s not dramatic – but Eco Mode makes the difference visible: it throttles the Wi-Fi chip during idle periods, and the outside temperature drops to 23 degrees. Less heat means less power consumption and, above all, slower aging of the electronics. I’ve personally repaired Shellys with failed capacitors before. What goes wrong during installation – from too little space in the box to the wrong tools – I cover in a separate article: 5 mistakes almost everyone makes when installing Shelly.
Use case 2: Exposing standby power hogs
In the thermal image: a box, clearly warmer than its surroundings. In the visual image: my Sonos Play One – 3.8 watts in standby, officially stated by Sonos.
For comparison: in 2010 the EU mandated that household devices may draw a maximum of 1 watt in standby. The Play One launched in 2013, but as an audio device with active network standby it falls under an exemption – a loophole Sonos is happy to use.
With five of them in my home, that means 20 watts around the clock: 175 kWh per year, roughly 50 euros – just for standby. I now deliberately disconnect them from the mains.
Use case 3: Comparing thermal design – Raspberry Pi vs. Zimaboard
On a Raspberry Pi 4 under load you immediately see chips and voltage regulators heating up in concentrated spots – the heat piles up at individual points. Small stick-on heat sinks barely make a measurable difference.
The Zimaboard 2 with its massive aluminum case shows the opposite: no sharp edges in the thermal gradient, no hotspots – the heat spreads evenly across the entire enclosure. The chip isn’t any cooler, but the energy is dissipated in a controlled way.
That’s the real value of the camera: you don’t just see whether something is hot – you see how a device handles heat.
Use case 4: Checking the solar array for hotspots
A neat effect: solar modules appear cooler than their surroundings in the thermal image – solar cells convert light into electricity rather than heat, and reflect part of the radiation.
What stands out are “blotches”: irregular heat patterns on individual modules. That’s a warning sign – it could be a cell defect or just dirt. In my case it was harmless (a sun reflection during filming), but the principle holds: otherwise your yield quietly drops without any visible reason from the outside.
A once-a-year scan of the array – a use case that pays off for every solar owner.
Use case 5: Charging an EV from an unknown Schuko socket
On my road trip to Croatia I charged my EV from a Schuko socket at a vacation rental – an unfamiliar electrical installation of unknown age and dimensioning. Schuko sockets are not designed for continuous full load at 16 amps.
My approach: start at the mobile wallbox’s minimum (6 A), check the thermal image, then step up to 10 A. Wallbox and charging cable visibly warm up – that’s just physics. A look straight into the socket (cable briefly unplugged): warm, but well within limits. Continuous charging at 10 A was no problem at this socket.
Without the camera I would have either charged far too cautiously or simply hoped for the best.
Conclusion
Heat is, in the end, nothing but wasted energy – and a thermal camera makes it visible before any sensor does. For smart home users with their own electrics, a home server, a solar array, or an EV, it’s a tool that pays off surprisingly often.
Deal (until June 28 only): The Thermal Master P3 is €45 off on Amazon* – discount code THERMALCM10. According to the manufacturer, the best price this year.
* Links marked with an asterisk are affiliate links. As a partner I earn from qualifying purchases – at no extra cost to you.